One of my favorite quotes is from Brian Kernighan, who wrote: “Everyone knows that debugging is twice as hard as writing a program in the first place. So, if you’re as clever as you can be when you write it, how will you ever debug it?”
Debugging performance-optimized code is especially challenging. Any programmers pushing their code for performance, and especially when doing parallel programming, are exercising their “clever” side to get the job done.
Intel Analysis Tools Are Invaluable
Intel has a long history of delivering advanced debugging and performance analysis tools. The recent release of Intel® Parallel Studio XE 2019 highlights Intel’s continued push to make a difference for software developers looking for performance.
Intel
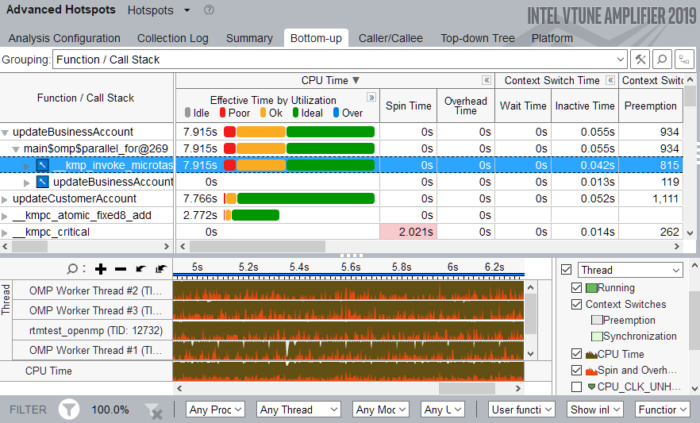
The Intel VTune Amplifier tool can accurately profile C, C++, Fortran, Python, Go, and Java code. Even when mixed together!
Intel Parallel Studio XE is an expansive suite of tools made specifically for building and analyzing software written in C, C++, Fortran, or Python. The Intel VTune Amplifier tool has been referred to as the “Cadillac” of performance tools, and I wouldn’t disagree. I have found it can also help me sort out performance issues with Java, COBOL, Lua, and even binaries for which I do not have the source code. That’s because the analysis tools are incredible at revealing what is really going on within my systems no matter why.
Intel has also extended profiling tools to help with enterprise applications inside Docker and Mesos containers, those using Python, and those running Java services and daemons.
Application Performance Snapshots
Perhaps to offer options other than the high-end Cadillac of performance tools, there are novel and relatively new capabilities in Parallel Studio XE 2019 that Intel calls “Application Performance Snapshots.” They are particularly successful at making it less daunting to do advanced and insightful profiling quickly when looking at memory, network, storage, MPI, CPU, and FPU usage. The closely related “Roofline Analysis” helps pinpoint high-impact, under-performing loops that are worth tuning. Both help with performance, but I have found that surprising feedback is often helpful at finding “correctness bugs” in code as well. This is especially true when I’m “clever” in my parallel programming.
 Intel
Intel
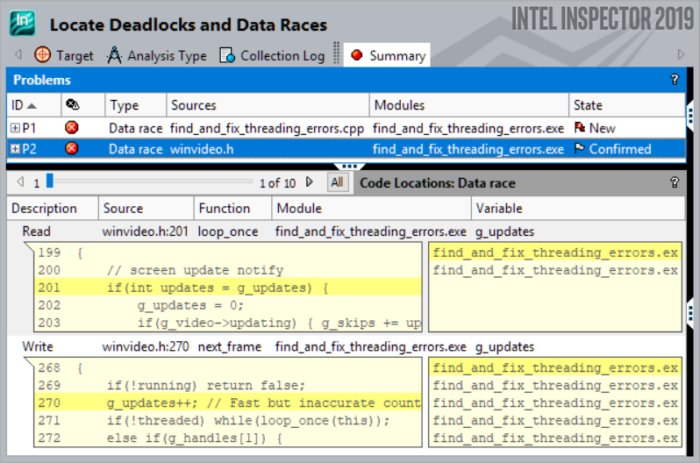
Parallel programming bugs are particularly hard to pinpoint, and the Intel Inspector tool can help even when a program is not misbehaving.
Debugging in the presence of Concurrency or Parallelism
Parallel programming bugs are particularly expensive to miss and to debug after you ship an application. The Intel Inspector tool can find errors even when an application isn’t currently producing them. Newer tests in the 2019 edition can find missing or redundant cache flushes, missing store fences, out-of-order persistent memory stores, and transaction redo logging errors with the Persistent Memory Developer Kit (PMDK).
 Intel
Intel
Parallel programming by thinking in terms of a Flow Graph is powerful, and well supported by Intel’s Flow Graph tool.
Flow Graphs Are A Powerful Way To Do Effective Parallel Programming
The Flow Graph Analyzer (FGA) is a hero-level tool to some users of Intel Threading Building Blocks (TBBs), and I expect it will get more and more attention in the upcoming years. It finally ships with Parallel Studio, and in an upcoming book on parallel programming with Intel Threading Building Blocks there are multiple chapters dedicated to the power of Flow Graph programming, and showing how valuable the FGA can be. The FGA allows us to interactively build, validate, and visualize algorithms that use TBBs—even as we write code. It aims to help us visualize the structure of a parallel program; the critical path analysis feature helps focus us on the critical sections when tuning.
Finally, with many benchmarks showing off the performance benefits of the compilers, the Python distribution, and the libraries, perhaps the analysis tools are the unsung heroes of this suite. I have certainly known tools like the VTune Analyzer to get me out of a jam more than a few times. Perhaps they can help you too!
You can learn more at the Intel website, where you can download the software to try it out.
Useful links for more information
