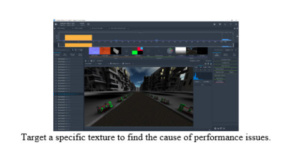
The Intel® Graphics Performance Analyzers (Intel® GPA) team describes their tool with this tag line: “Improve your game’s performance by quickly identifying problem areas.” Any program that depends on good frame rates will benefit from this free Intel tool. GPA reveals what is really happening at the draw call level for any given frame – allowing a user to see what is affecting framerate. The latest “2018 R2” release is now available, along with an introductory video.
GPA is really four related tools:
- System Analyzer: Isolate common bottlenecks during live gameplay (real-time) with GPU and CPU metrics (via the heads-up display or HUD) and live experiments.
- Graphics Frame Analyzer: More in-depth, offline analysis for a single frame, down to the draw call level.
- Graphics Multiframe Analyzer: Capture and analyze multiple frames for macOS Metal applications.
- Graphics Trace Analyzer: Analyze how to evenly distribute workloads across the CPU and GPU.
The GPA team has a long-standing history of supporting Microsoft DirectX applications for performance analysis, growing over the years to also include support for OpenGL (Ubuntu, and macOS), OpenGL ES, and macOS Metal. There’s also GCN counter support for the AMD Radeon RX Vega-M graphics card inside the new Intel NUC.
Scanning the Intel GPA forums, there are recurring questions about multi-GPU systems. The R1 release, a few months ago, added support for the ability to choose a playback GPU target for a particular frame. This should be helpful when profiling an Intel GPU on a system where both an Intel GPU and a non-Intel GPU are available. Previously, it was possible to do this manually by disabling the GPU that you did not want to profile. Which is painful, to say the least. This new feature is proving popular as many machines have multiple GPUs, and this solution proves to be less cumbersome. The R2 release expands to include support for DirectX 12 Unreal Engine 4.19 applications running on multi-GPU systems.
The R2 release adds metrics to System Analyzer and Frame Analyzer for OpenGL macOS applications, support for the new Intel Hades Canyon NUCs, and some new experiments within Frame Analyzer. Intel GPA now fully supports profiling OpenGL applications on macOS High Sierra 10.13.4 and above. In addition, R2 allows users to select a single input texture and replace it with a two-by-two texture. GPA will then play back the frame, generate the new output, and show the performance delta in the Metrics tab.
Debug textures vs. performance
An example of GPA capabilities, new to R2, is the ability to apply experiments to single textures. This can help verify the source of performance issues quickly. You can apply a 2×2 texture to any given Shader Resource View (SRV) or clamp a texture to a specific mip-map level. Using these experiments, you can narrow down the issues within any given draw call and pinpoint exactly which texture resolution and mip-map level can meet your performance needs.
Reindeers
View metrics in pursuit of performance
Another example of GPA capabilities is the ability to analyze metrics for OpenGL applications as the application runs (in real-time). A full set of metrics for OpenGL applications can be viewed with the System Analyzer. These same metrics can be seen in Frame Analyzer allowing for deeper analysis of particular events and the use of the 3D Pipeline view. This feature makes it possible correlate performance issues with metrics during live gameplay and offline analysis.
GPA has staying power
The Intel GPA tool set remains popular because it puts useful information in the hands of developers who are trying to performance tune graphical applications on Intel hardware. With such a great track record and a free download, I can’t imagine why it wouldn’t find a place alongside other performance tools in every developer’s toolkit.
Useful links for more information
