Visibility is a blessing, and with databases, visibility is a must. That’s true not only for metrics but for the queries themselves. Having info on all the stats around query execution is priceless, and Percona Monitoring and Management (PMM) offers that in the form of the Query Analytics dashboard (QAN).
But where to start? QAN helps you with that by calculating the query profile. What is the profile? It’s a rank of queries, ordered by Load, so it is easy to spot the heaviest queries hitting your database. The Load is defined as the “Average Active Queries” but can also be defined as a mix of Query Execution Time Plus Query count. In other words, all the time the query was alive and kicking.
The Profile in PMM 2.10.0 looks like this:

The purpose of this profile is to facilitate the task of finding the queries that are worth improving, or at least the ones that will have a bigger impact on the performance when optimized.
However, how do you know that a slow query has been always slow or it has come down the road from good performance to painfully slow? That’s where the graph on the “Load” column comes handy.
There’s a method for doing this. The first step is to have a wide view. That means: check a time range long enough so you can see patterns. Personally, I like to check the last 7 days.
The second step is to find irregularities like spikes or increasing patterns. For example, in the above profile, we can see that the “SHOW BINARY LOGS” command is the top #4 of queries adding more load to the database. In this case, it’s because the binlogs are not being purged, so every day there are more and more binlog files to read and that adds to the executing time. But the amount of times that the “SHOW BINARY LOGS” query is executed remains the same.
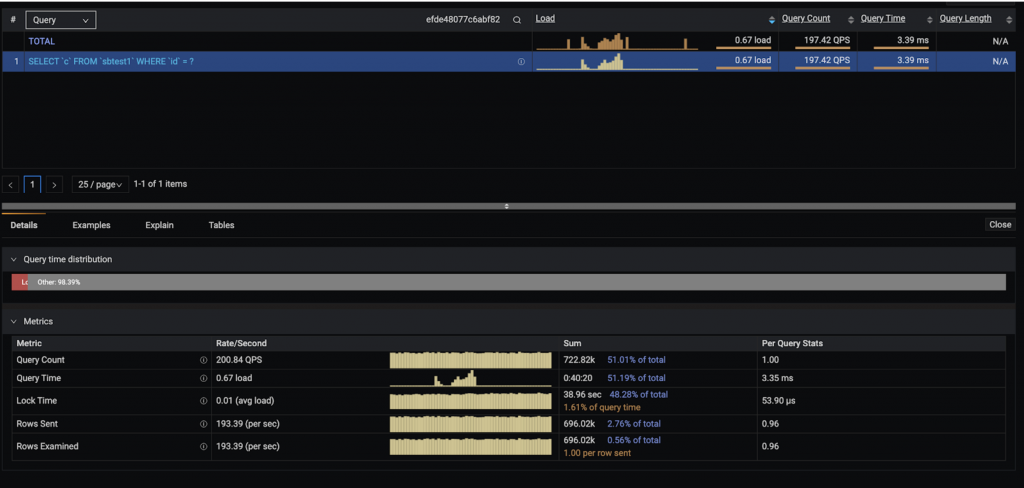
Another query with an “anomaly” in the load graph is the top #3 one. Let’s isolate it and see what happened:

The third step will be to reduce the time to a range involving the event so we can isolate it even more:

The event happened between 8 AM and 9 AM. To discard or confirm that is an isolated event only related to this query, let’s see again all the queries running at that same moment.

So this is a generic situation, common to several queries. Most likely it was an event with the server that made queries to stall.
By looking at the threads graph, we can confirm that hypothesis:

After some digging, the source cause was detected to be a Disk problem:

It’s confirmed that it is not an issue with the query itself, so no need to “optimize” due to this spike.
In conclusion, with the new QAN dashboard available since PMM 2.10.0, finding query slowdowns is easier thanks to the Load graph that can give us context pretty fast.
Try Percona Monitoring and Management today, for free!
