At work, I am in an ongoing discussion with a number of people on the Observability of Outliers. It started with the age-old question “How do I find slow queries in my application?” aka “What would I want from tooling to get that data and where should that tooling sit?”
As a developer, I just want to automatically identify and isolate slow queries!
Where I work, we do have SolarWinds Database Performance Monitor aka Vividcortex to find slow queries, so that helps. But that collects data at the database, which means you get to see slow queries, but maybe not application context.
There is also work done by a few developers which instead collects query strings, query execution times and query counts at the application. This has access to the call stack, so it can tell you which code generated the query that was slow.
It also channels this data into events (what we have instead of Honeycomb), and that is particularly useful, because now you can generate aggregates and keep the link from the aggregates to the constituting events.
How do you find outliers?
“That’s easy”, people will usually say, and then start with the average plus/minus one standard deviation. “We’ll construct this “n stddev wide corridor around the average” and then look at all the things outside.”
No.
That is descriptive statistics for normal distributions and for them to work we need to actually have a normal distribution.
Averages and Standard Deviations work on normal distributions. So the first thing we need to do is to look at the data and ensure that we actually have a normal distribution.

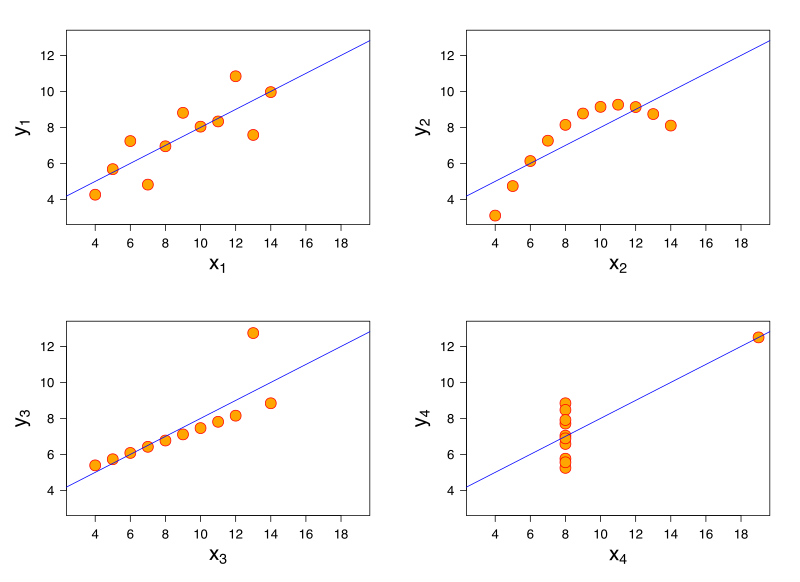
Anscombe’s Quartet is a set of graphs having an identical number of points, and producing identical descriptive statistics, but being clearly extremely different distributions.
Because when you apply the Descriptive Statistics of Averages and Standard Deviations to things that are Not a Normal Distribution (see Anscombe’s Quartet) they do not tell you much about the data: all the graphs in the infamous Quartet have the same descriptive stats (more than just average and stddev, even), but are clearly completely different.
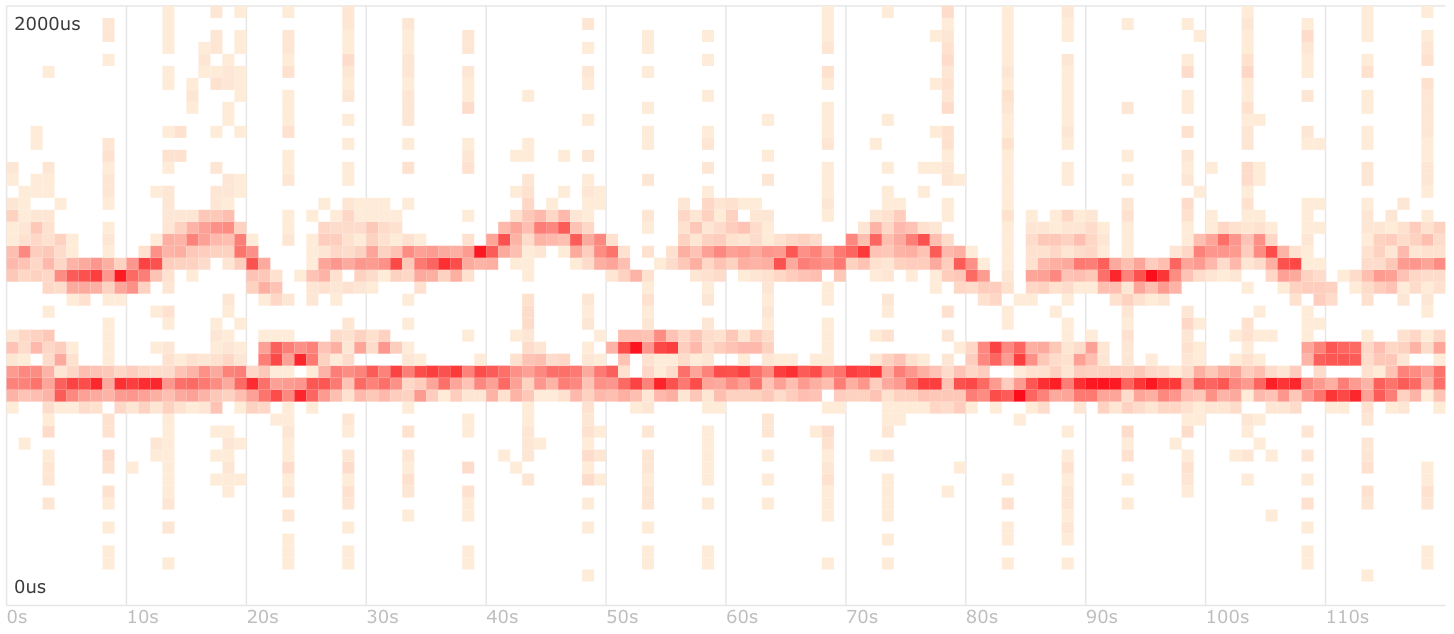
So what we would want is a graph of the data. For a time series – which is what we usually get when dealing with metrics – a good way to plot the data is a heatmap. For the given problem, the heatmap more often than not looks like this:

We partition the time axis into buckets of – say – 10s each, and then bucket execution times linearly or logarithmically. For each query we run, we determine the bucket it goes into and increment by one. The resulting numbers are plotted as pixels – darker, redder means more queries in that bucket. A flat 2D plot of three dimensional data.
What you see here is a bi- or multipartite distribution. It is a common case when benchmarking: We have a (often larger) number of normally executed queries, and a second set (often smaller) of queries that need our attention because they are executed slower.
The slow set is also often run with unstable execution times – an important secondary observation.

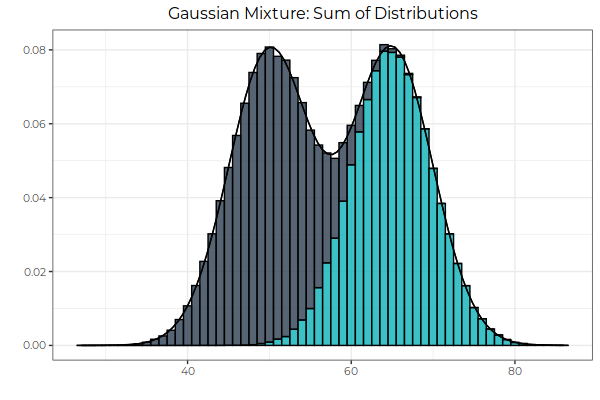
This is not a normal distribution, but a thing composed of two other things (hence bipartite), each of which in itself hopefully can be adequately modelled as a normal distribution: A gaussian mixture.
Luckily we do not actually have to deal with the math of these mixtures (I hope you did not follow the Wikipedia link 🙂 ) when we want to find slow queries.
We just want to be able to separate them, which could even be done manually, and then want the back pointer to the events that constitute the cluster of outliers we identified.
Unstable execution times
I mentioned above:“They are also often run with unstable execution times – an important secondary observation.”
Slow queries are often slow because they cannot use indexes. When a tree index can be used, the number of comparisons needed to find the elements we are searching for is some kind of log of the table size.
The end result is usually 4 – there are 3-5 lookups¹ needed in about any tree index to do a point lookup of the first element of a result. That means that the execution time for any query using proper indexes is usually extremely stable.
When indexes cannot be used, the lookup times are scan times – linear functions of the result position or size. This varies a lot more, and so we get much more variable execution times for slow queries, and the jitter makes it only worse: your “this query takes 20s instead of 20ms to run” degrades to the even more annoying “well, sometimes it’s 5s, and sometimes 40s”.
¹ In MySQL, we work with 16KB block size, and in indexes we usually have a fan out of a few hundreds to one thousand per block or tree level. The depth of the index tree is the number of comparisons, and it is log to the base of (fan out) of the table length in records. This then becomes ln(table length)/ln(fan out), because that is how you get arbitrary base logs from ln().
For a fan out of 100, we get a depth of 3 for 1 million, and 4.5 for 1 billion records.
For a fan out of 1000, it’s 2 for the million, and 3 for the billion.
Plus one for the actual record, so the magical database number is 4: It’s always 4 media accesses to get any record through a tree index – stable execution times for indexed queries, because math works.
Where Monitoring ends and Observability begins
With measurements, aggregations, and the visualisation as a heatmap, I can identify my outliers – that is, I learn that I have them and where they are in time and maybe space (group of hosts).
But with a common monitoring agents such as Diamond or Telegraf, what is being recorded are numbers or even aggregates of numbers – the quantisation into time and value buckets happens in the client and all that is recorded in monitoring is “there have been 4 queries of 4-8ms run time at 17:10:20 on host randomdb-2029”. We don’t know what queries they were, where they came from or whatever other context may be helpful.
With events, we optionally get rich records for each query – query text, stack trace context, runtime, hostname, database pool name and many other pieces of information. They are being aggregated as they come in, or can be aggregated along other, exotic dimensions after the fact. And best of all, once we find an outlier, we can go back from the outlier and find all the events that are within the boundary conditions of the section of the heapmap that we have marked up as an outlier.
This also is the fundamental difference between monitoring (“We know we had an abnormal condition in this section of time and space”) and observability (“… and these are the events that make up the abnormality, and from them we can see why and how things went wrong.”).
(Written after a longer call with a colleague on this subject).
First published on https://blog.koehntopp.info/ and syndicated here with permission of the author.
The post On the Observability of Outliers appeared first on Percona Community Blog.
