Understanding how MySQL uses memory is key to tuning it for optimal performance as well as troubleshooting cases of unexpected memory usage, i.e. when you have MySQL Server using a lot more than you would expect based on your configuration settings.
Early in MySQL history, understanding memory usage details was hard and included a lot of guesswork. Is it possible that some queries running require a large temporary table or allocated a lot of memory for stored user variables? Are any stored procedures taking an unexpectedly high amount of memory? All could be reasons for excessive MySQL memory usage, but you would not easily see if that is just the case.
All that changed with MySQL 5.7, which added memory instrumentation in Performance Schema, and with MySQL 8.0, this instrumentation is enabled by default, so you can get this data from pretty much any running instance.
If you’re looking for current memory usage details, Sys schema provides fantastic views:
mysql> select event_name,current_alloc from sys.memory_global_by_current_bytes limit 10;
+---------------------------------------------------------------+---------------+
| event_name                                                    | current_alloc |
+---------------------------------------------------------------+---------------+
| memory/innodb/buf_buf_pool                                    | 262.12 MiB    |
| memory/temptable/physical_ram                                 | 64.00 MiB     |
| memory/performance_schema/events_statements_summary_by_digest | 39.67 MiB     |
| memory/sql/TABLE                                              | 33.32 MiB     |
| memory/innodb/ut0link_buf                                     | 24.00 MiB     |
| memory/innodb/lock0lock                                       | 20.51 MiB     |
| memory/innodb/memory                                          | 17.79 MiB     |
| memory/innodb/buf0dblwr                                       | 17.08 MiB     |
| memory/innodb/ut0new                                          | 16.08 MiB     |
| memory/performance_schema/events_statements_history_long      | 13.89 MiB     |
+---------------------------------------------------------------+---------------+
10 rows in set (0.01 sec)
This view shows the current memory allocated overall. You can also drill down further, by looking at memory allocated by connections coming from different hosts:
mysql> select host,current_allocated from memory_by_host_by_current_bytes;
+-------------------------------+-------------------+
| host                          | current_allocated |
+-------------------------------+-------------------+
| localhost                     | 1.19 GiB          |
| background                    | 101.28 MiB        |
| li1317-164.members.linode.com | 49.61 MiB         |
| li1319-234.members.linode.com | 27.90 MiB         |
| li1316-24.members.linode.com  | 27.00 MiB         |
+-------------------------------+-------------------+
5 rows in set (0.02 sec)
Or even check allocation by given thread_id which can be super helpful to diagnose memory-heavy transactions or queries:
mysql> select thread_id,user,current_allocated from memory_by_thread_by_current_bytes limit 5;
+-----------+------------------------------------+-------------------+
| thread_id | user                               | current_allocated |
+-----------+------------------------------------+-------------------+
|        44 | innodb/srv_worker_thread           | 1.99 MiB          |
|        48 | innodb/srv_worker_thread           | 1.16 MiB          |
|     54322 | root@localhost                     | 1.10 MiB          |
|        46 | innodb/srv_worker_thread           | 777.29 KiB        |
|     43881 | app1@li1317-164.members.linode.com | 274.84 KiB        |
+-----------+------------------------------------+-------------------+
5 rows in set (0.43 sec)
Looking at current stats, though, is not very helpful to diagnose past incidents or even to answer the question of why a particular object taking so much memory is normal or excessive. For this, you better have history captured and available for trending… exactly what Percona Monitoring and Management (PMM) is designed for.
Unfortunately, as of PMM 2.11, we do not have Performance Schema Memory Instrumentation included in the release. It is, however, quite easy to get it added using Custom Queries.
MySQL Custom Queries
Custom Queries is a great feature that allows you to get stats from a local MySQL instance using standard SQL queries and make them available together with other metrics collected by MySQL exporter. This can be used for Performance Schema tables, Information Schema tables, or even queries on your own schema to expose data you consider relevant for your application. Check out our Custom Queries In Percona Monitoring and Management blog post for more details.
You can install the custom queries to read memory use statistics from MySQL Performance Schema this way…
cd /usr/local/percona/pmm2/collectors/custom-queries/mysql/medium-resolution
wget https://raw.githubusercontent.com/Percona-Lab/pmm-custom-queries/master/mysql/ps-memory-summary.yml
when you install the MySQL Memory Usage Details dashboard from Grafana.com. Let’s see what you get by having this dashboard installed.
First, we have the block which does not have much to do with the information we capture from Performance Schema but provides some helpful background in interpreting such information:

We can see how long the system and MySQL process have been up, how much memory the system has and how much is available, whenever there is any aggressive swapping activity going on, etc., and all of those help us to know whenever MySQL is currently using too much memory… or too little. We can show the number of current connections, which is a common driver of high memory utilization as well as a couple of variables that can impact memory consumption.
The MySQL Memory Usage Summary shows how much memory different objects contain, as well as what the total instrumented memory allocated by the MySQL process is.

With hundreds of different places where memory can be allocated, even memory consumers which are not at the top can add up to a lot:

When we have memory allocation by Host and by User, these only cover memory which can be attributed to specific connections but is a great tool to see if there are particular hosts, users, or applications that are significant memory consumers.

You can also see memory usage details by specific accounts (a given user coming from a given host). This is as far as we go with dashboards, as specific Connection IDs (and Thread IDs) tend to change so quickly that they are not particularly helpful for long term capture.
You may also have noticed I unselected the pmm@localhost user, as it looks like this user workload triggers some bug in memory accounting and unrealistic numbers get reported (this is also something you need to keep in mind, to not trust the data you see blindly).

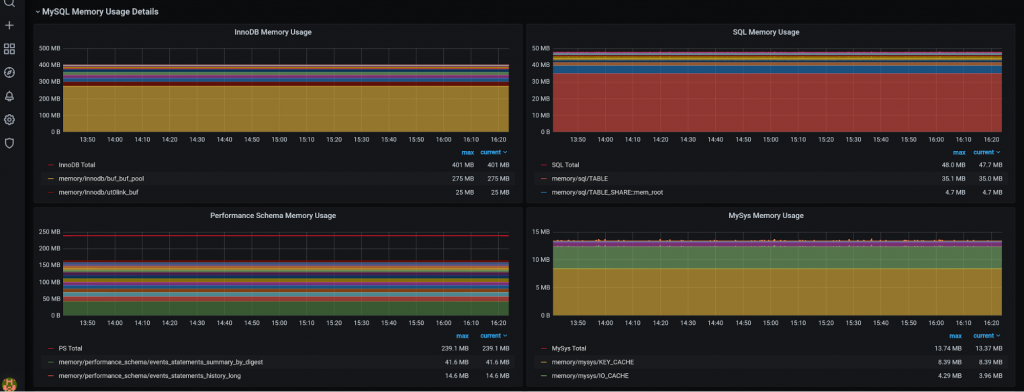
Finally, you can see memory allocation by different subsystems, which can be rather helpful for advanced analyses, where just the global top consumers do not provide enough information.
What do you think? Is it helpful, or would you like to see some additional visualizations added before we consider including this feature in Percona Monitoring and Management?
